Cost Profiles
For data in table format, we recommend using CP Planning - Asset View or CP Planning - Package View
The Cost Profile chart shows a total costs for the control period, showing remitted and unremitted packages seperately.
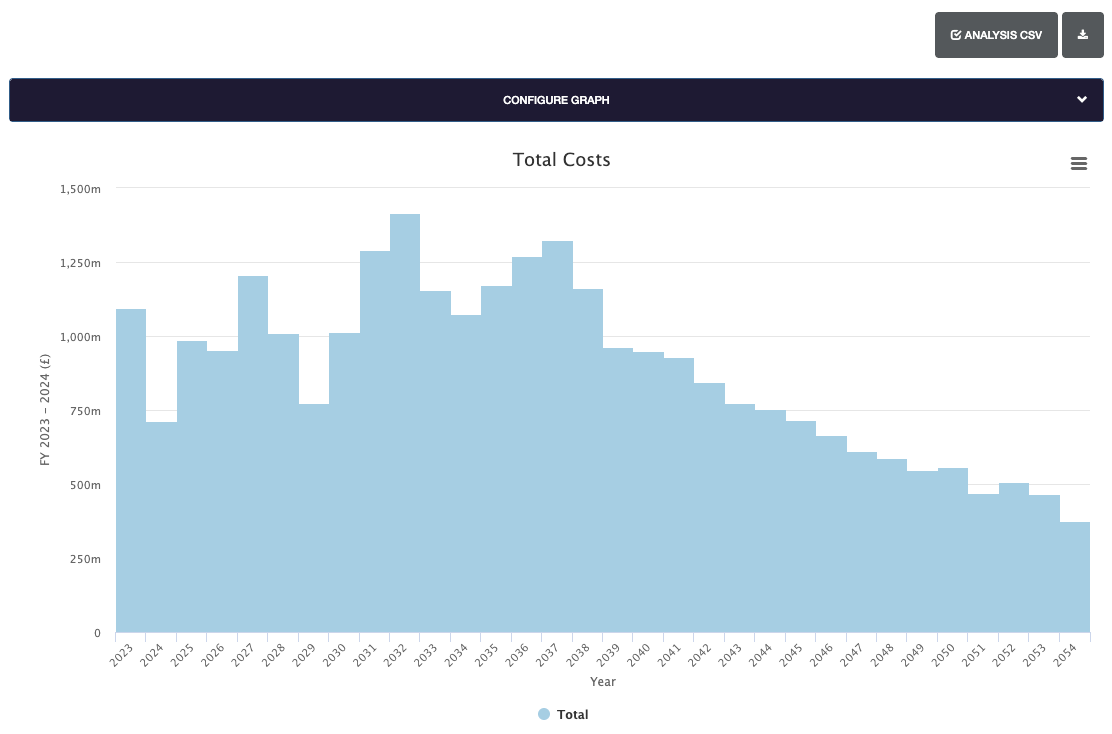
Clicking on any bar in the chart will display a breakdown of costs.
Graph Configuration
The graph can be configured by selecting the Configure Graph header bar.
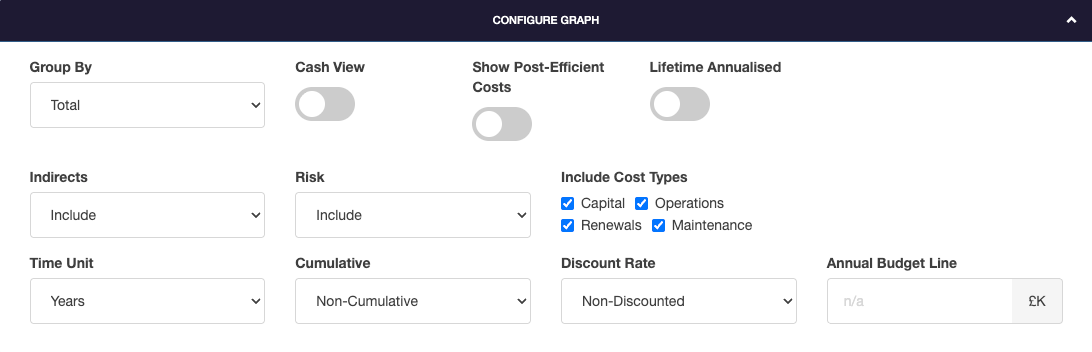
Group By
Group By allows the graph grouping to be changed. Options include groupings by Workbank, RMM, Area or Category Schemes.
Cash View
Toggles to view cash views including YoY inflation. With this toggle off, a consistent price base is defined in option settings.
Show Post-Efficient Costs
Toggles to switch between post-efficient or original costs.
Lifetime Annualised
Toggles to show costs distributed evenly over renewal lifetime for applicable work types, instead of project profile.
Indirects
Indirects allows indirect costs to be included, excluded or shown seperately.
Risk
Risk allows risk related costs to be included, excluded or shown seperately.
Include Cost Types
Include Cost Types allows specific cost types to be included or excluded. To exclude a cost, untick it's selection box.
Time Unit
The time unit for the graph can be displayed in three different ways:
- Years
- Control Periods
- Periods
Cumulative
Cumulative sets if the graph is shown as cumulative, or non-cumulative data.
Discounted Rate
Discounted rate allows costs to be shown as non-=discounted, Network Rail discounts or Green Book discounts.
Annual Budget Line
Annual Budget Line allows the annual budget to be defined. This is displayed as a reference line on supported graph types.
Exports
To create an export, select the Export button.
The Volume Profile data can be exported in four different formats.
- CSV
- Excel, one tab per REGION
- Excel, one tab per ROUTE
- Excel, one tab per CROM