Delivery Modal
How To Open
Summary
Project Codes
Once a Project Code has been added, interventions can use the Change Control module.

Project Codes can be generated by selecting the Generate Project Code link, or entered manually by selecting the Add icon.
When entering a Project Code manually, the OP Number for the intervention should be used.
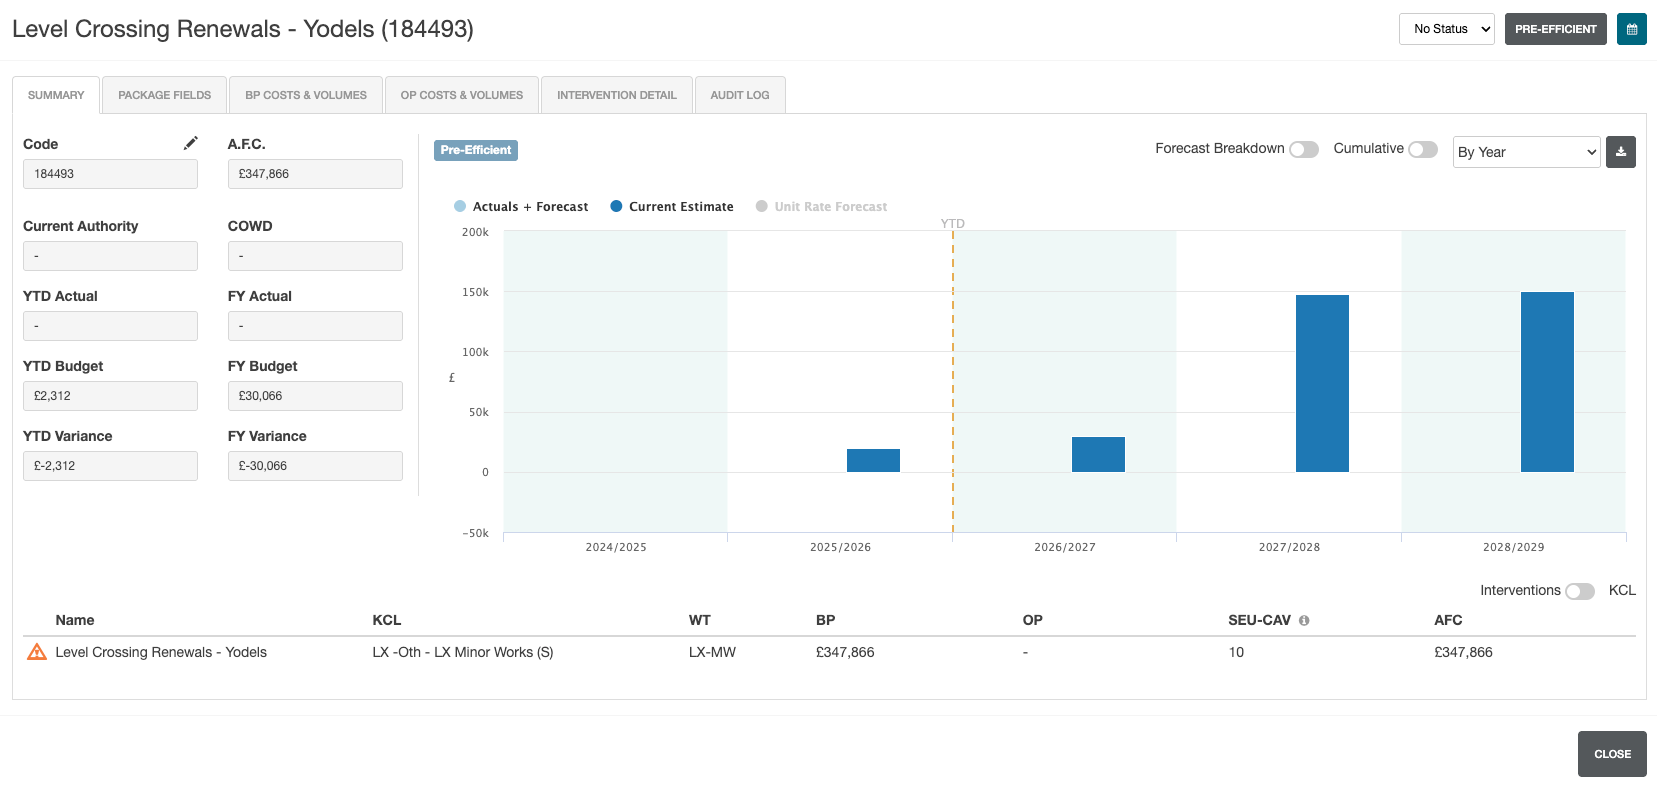
Summary Data
The following data is displayed on the Summary page:
| Field | Details |
|---|---|
| Code | Generated project code (or OP number) for the current intervention. |
| A.F.C. | Total project cost. |
| Current Authority | Current authority assigned to the intervention. |
| COWD | Cost of work done. |
| YTD Actual | Annual costs up to the last completed period. |
| FY Actual | Actual and estimated costs for the current financial year. |
| YTD Budget | Estimated costs up to the last completed period. |
| FY Budget | Estimated costs for the current financial year. |
| YTD Variance | Current year actual costs, minus current year budget (up to the last completed period). |
| FY Variance | Current financial year actual costs, minus financial year budget. |
Summary Graph
The Summary graph can be customised to show:
- Forecasted breakdown of costs
- Cumulative costs
This can be displayed over specific periods by selecting the By Year dropdown. This allows the graph to be displayed by period (based on the intervention periods)
Export Graph Data
Graph Data can be exported by selecting the Export icon

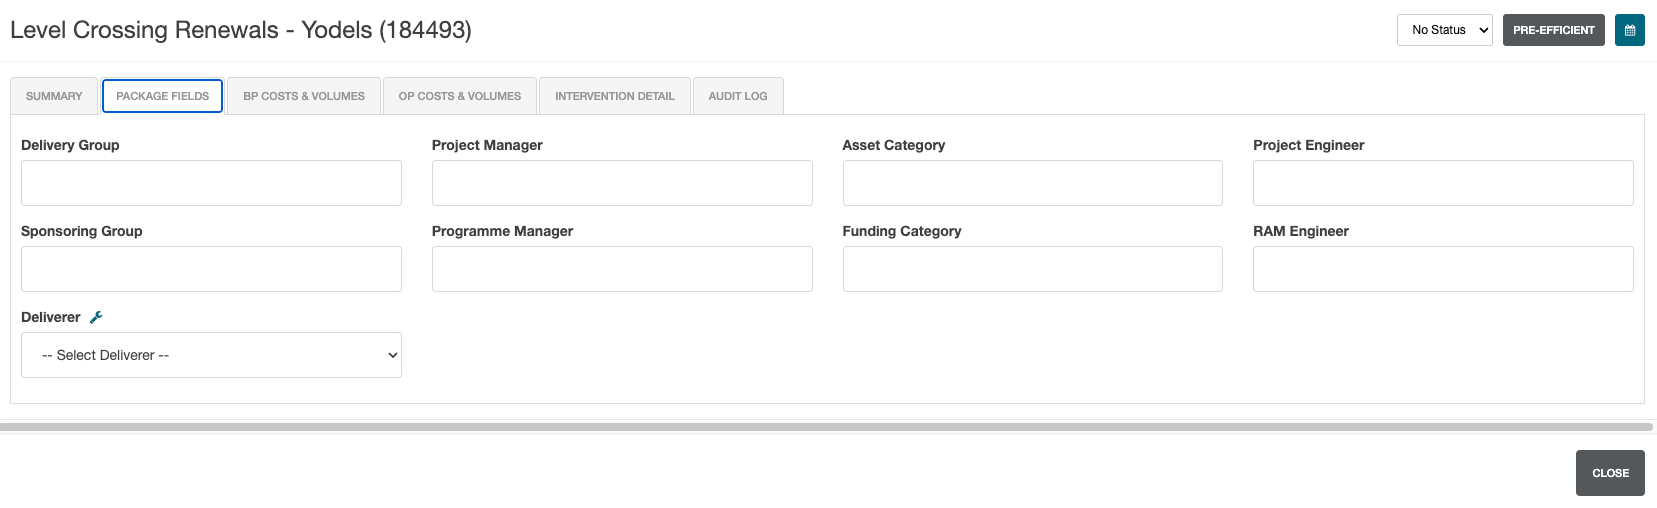
Package Fields
Package Fields covers intervention responsibilities.
ALl fields (with the exception of Deliverer) are free text fields.
| Field | Details |
|---|---|
| Delivering Group | The group responsible for delivery. |
| Project Manager | Name of the person responsible for managing the project. |
| Asset Category | The category of the assets within the intervention. |
| Project Engineer | Name of the project engineer. |
| Sponsoring Group | The group sponsoring the project. |
| Programme Manager | The name of the programme manager. |
| Funding Category | Which category of funding the intervention is covered by. |
| RAM Engineer | The name of the RAM engineer. |
| Deliverer | The name of the delivery unit. |
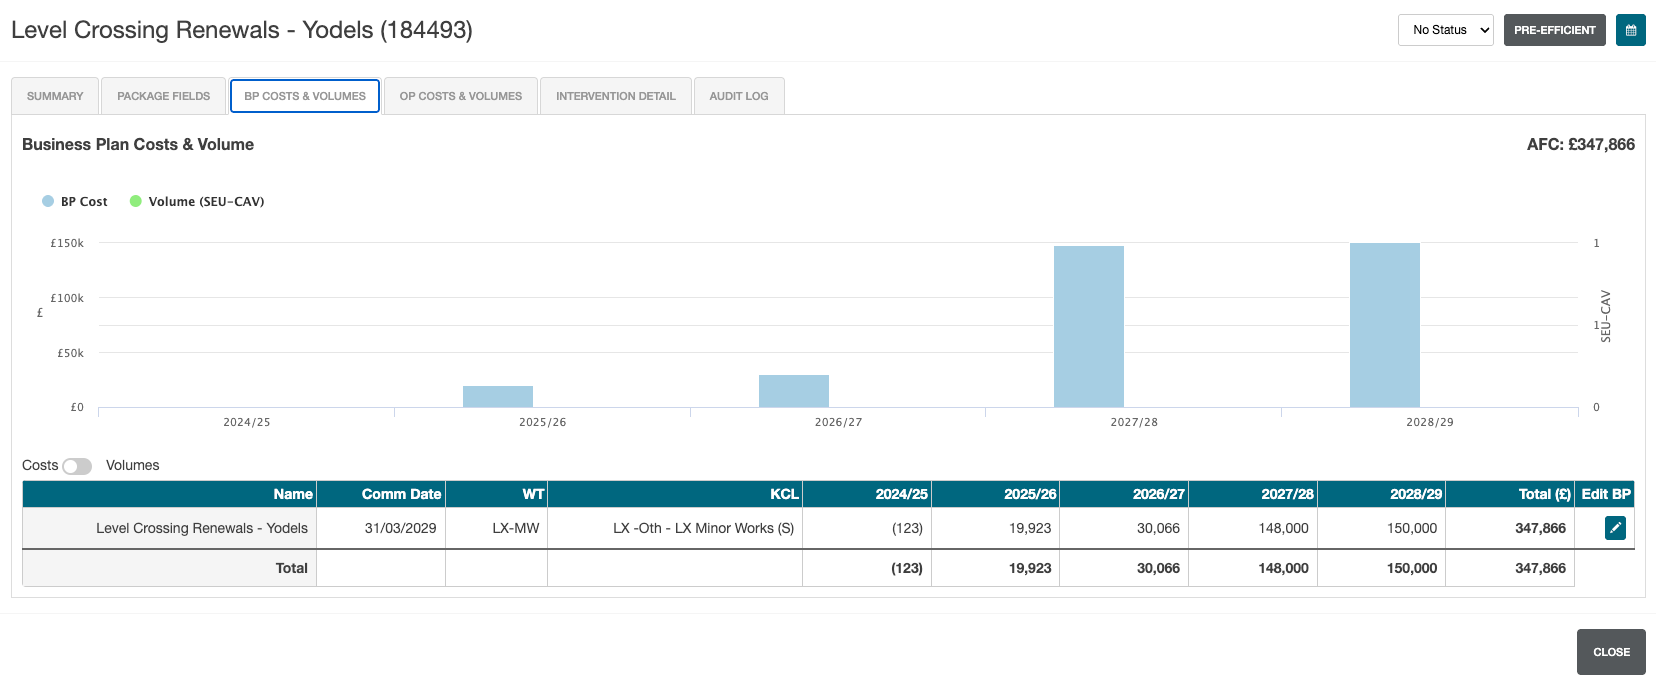
BP Costs & Volumes
BP (Business Plan) Costs & Volumes shows the estimated costs and volumes based on the business plan.
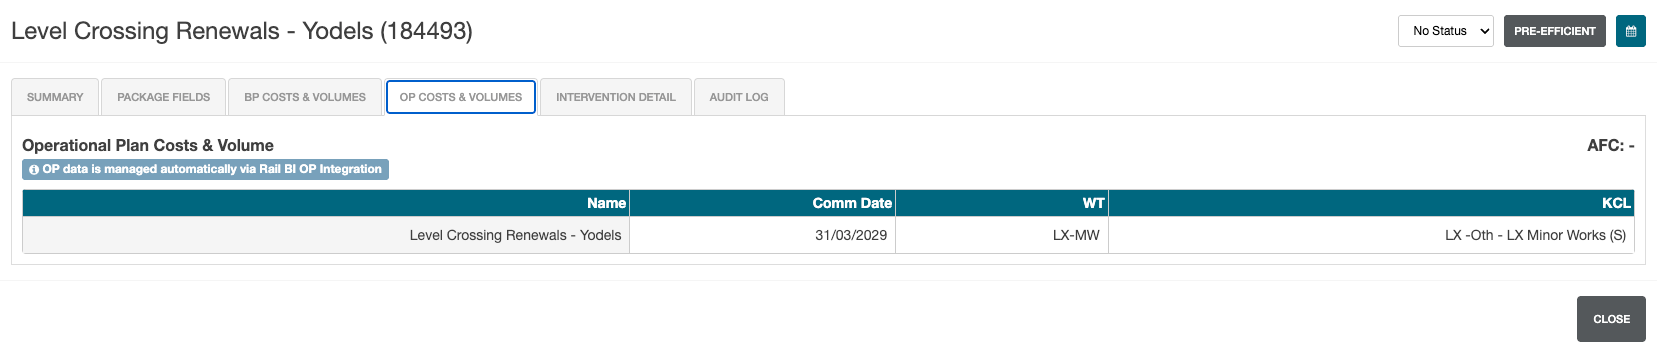
OP Costs & Volumes
OP Costs & Volumes is only populated if the Oracle Projects intergration is enabled.
OP (Oracle Projects) Costs & Volumes show the actual costs, imported from Oracle Projects.
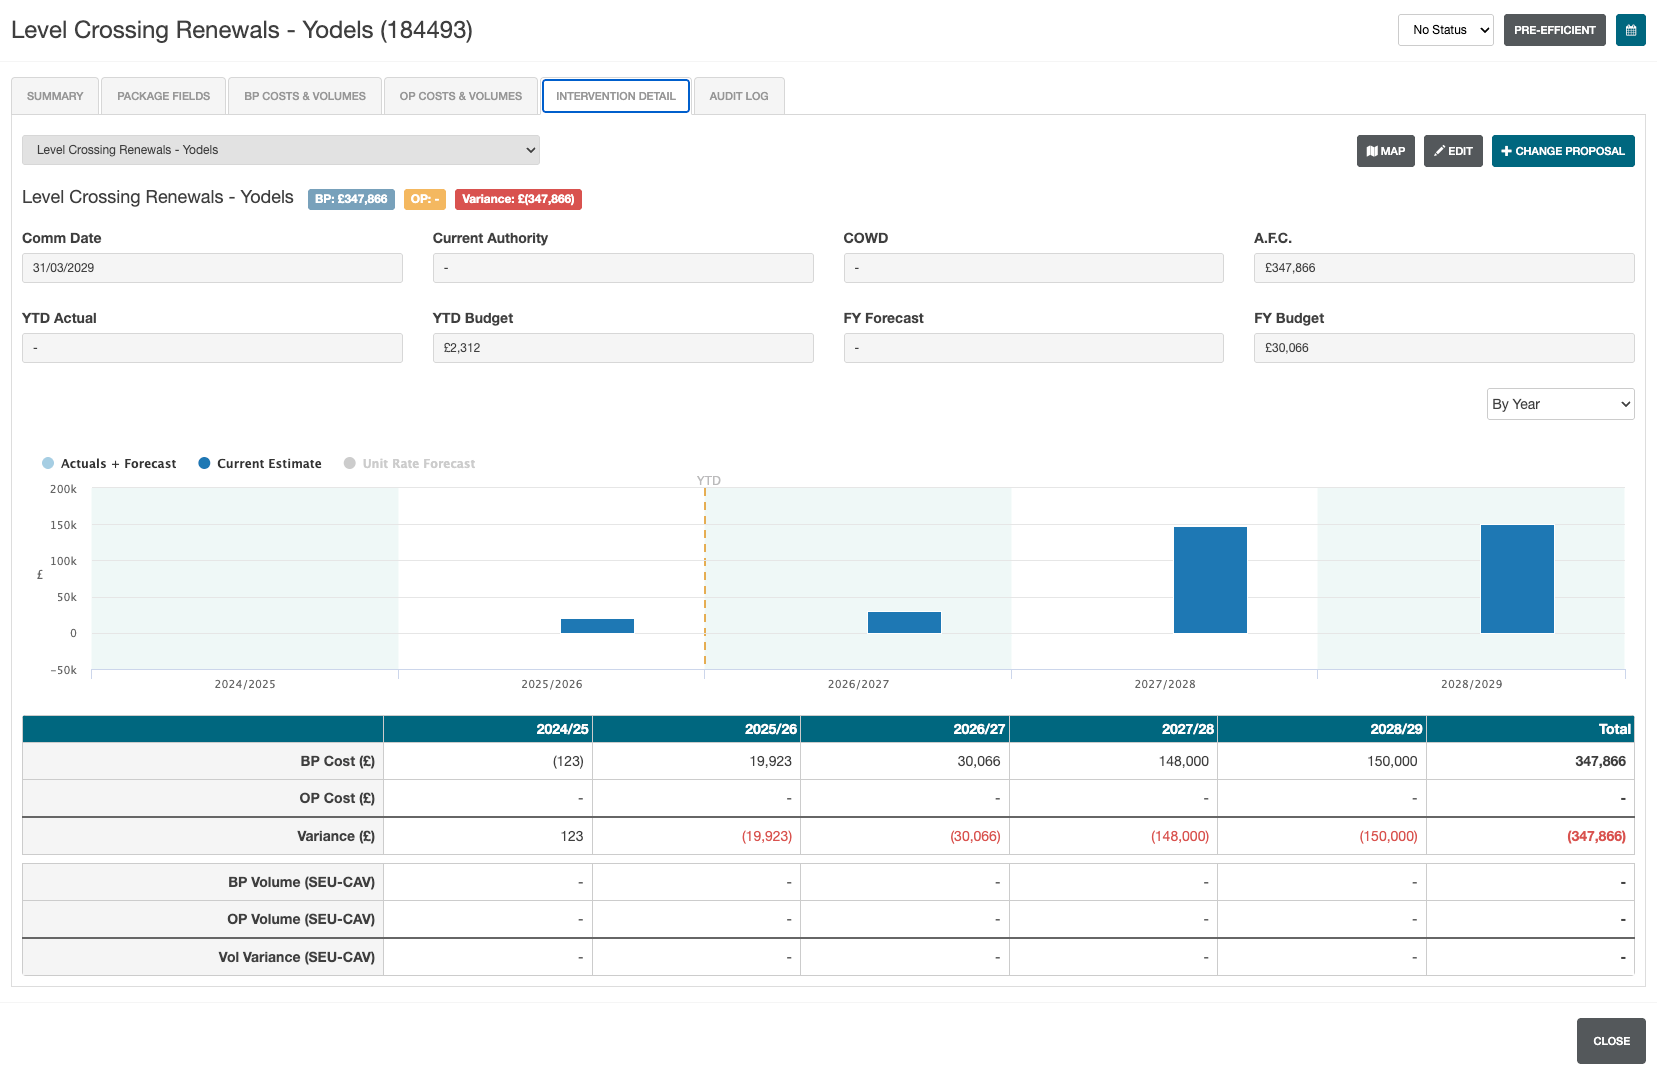
Intervention Detail
Intervention detail shows additional information not displayed on the Summary tab, including Commissioning Date.
This tab also allows for Change Proposals to be added for the current intervention.
Intervention Detail Data
The following data is displayed on the Intervention Detail page:
| Field | Details |
|---|---|
| Comm Date | Commissioning date of the intervention. |
| Current Authority | Current authority assigned to the intervention. |
| COWD | Cost of work done. |
| A.F.C. | Total project cost. |
| YTD Actual | Annual costs up to the last completed period. |
| YTD Budget | Estimated costs up to the last completed period. |
| FY Forecast | Actual and estimated costs for the current financial year. |
| FY Budget | Estimated costs for the current financial year. |
Intervention Detail Graph
The Intervention Detail graph is viewable by year, or by period. This can be adjusted by selecting the By Year dropdown.
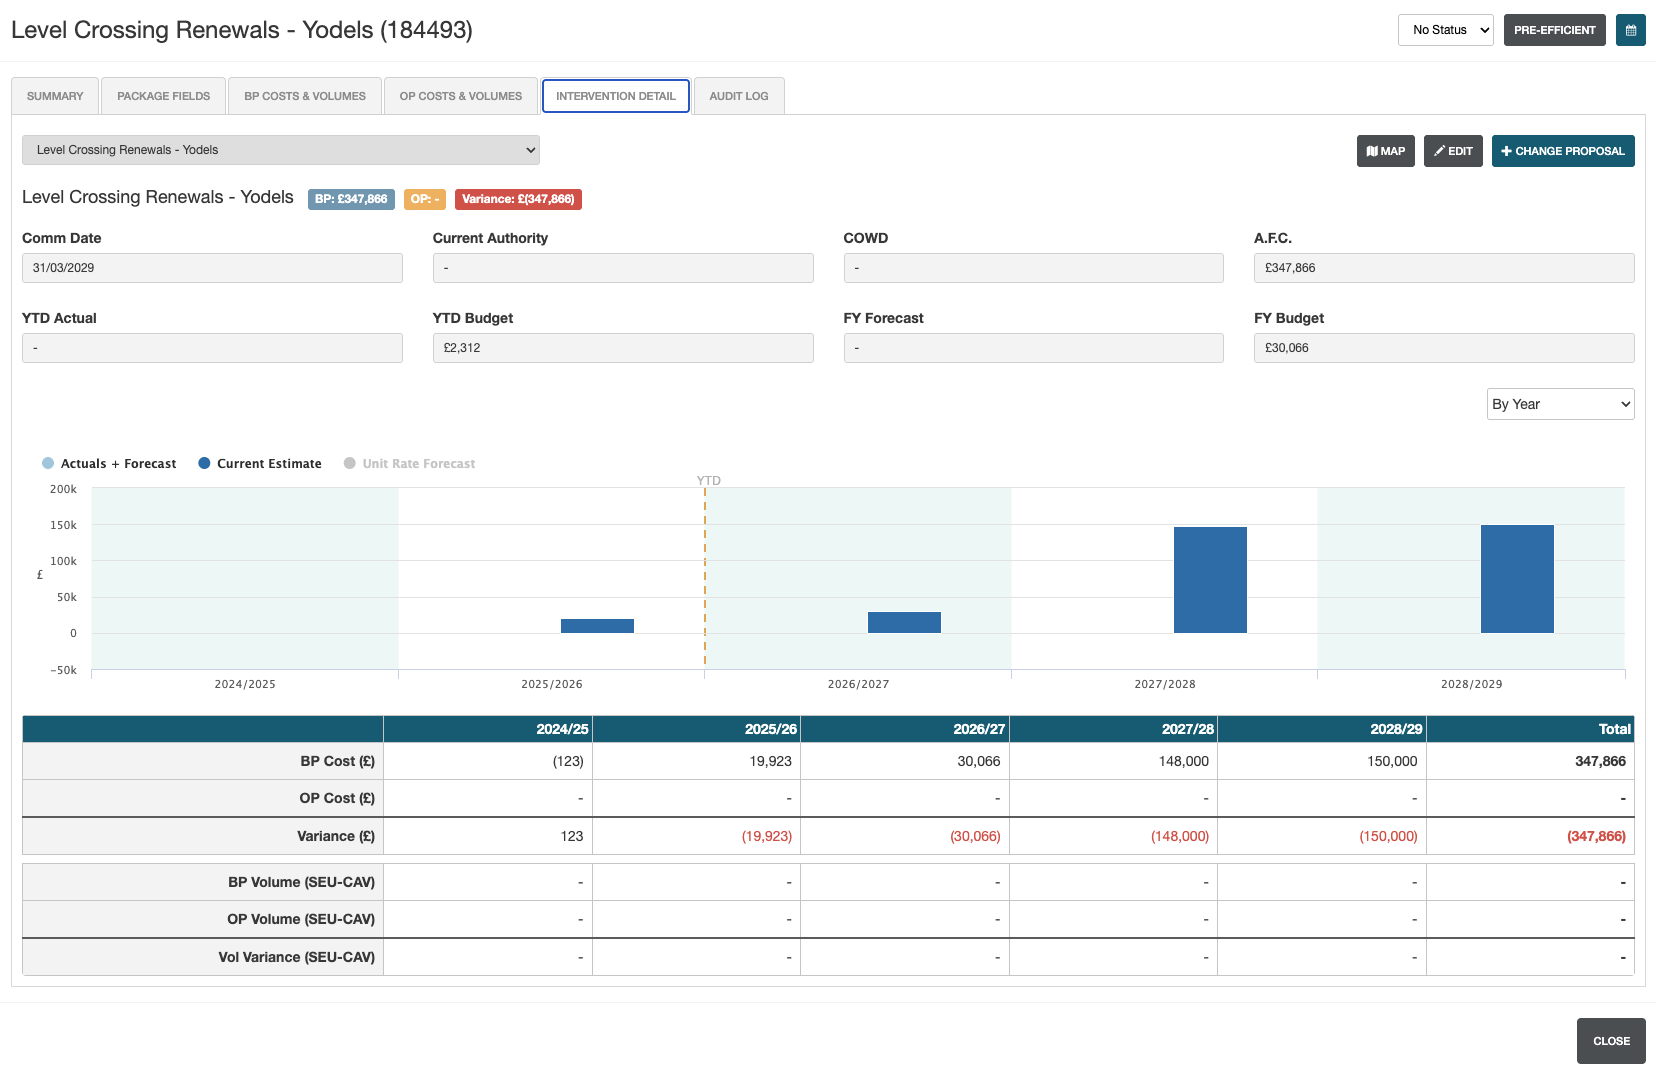
The table below shows a breakdown of the intervention data by period period with the following rows:
- BP Cost
- OP Cost
- Variance
- BP Volume (SEU-CAV)
- OP Volume (SEU-CAV)
- Volume Variance (SEU-CAV)
Audit Log
The audit log shows what changes have been made to the intervention along with when they were made.
This modal page has the same function as the Change Control module, but it is localised to the current intervention only.