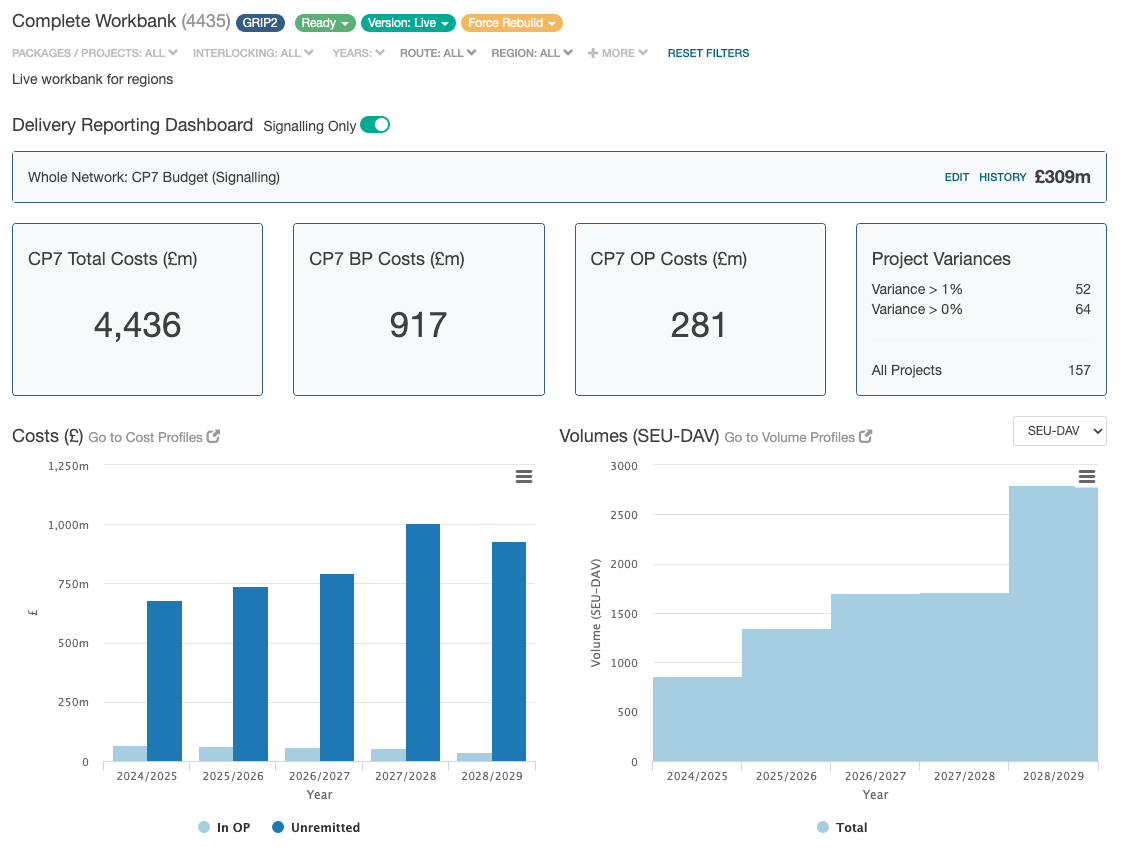
Delivery Reporting Dashboard
Using The Dashboard
The dashboard is an overview of all Delivery Report information.
This view retains any route filters that have been set on a workbank to define the network area to display data for.
Delivery Reporting Dashboard
Signalling Only Toggle
This toggle allows you to view the dashboard for all costs on the current workbank, or for signalling items only.
Signalling includes both signalling and level crossings. This does not include any minor works.
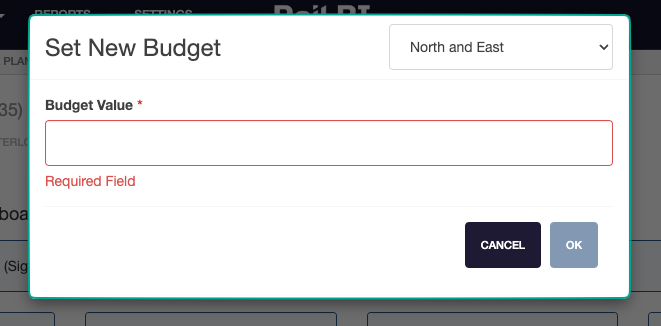
Budget
The total budget for the selected route is displayed here.
Selecting the Edit link allows the budget value to be adjusted by network area.
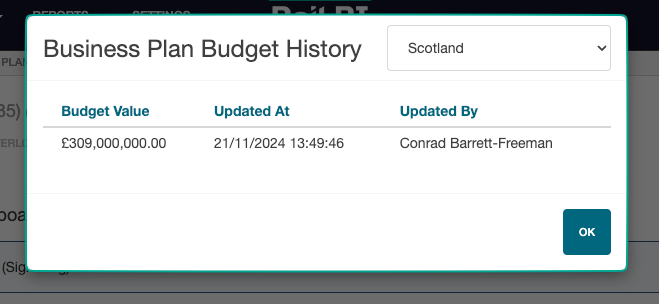
The History option shows any edits that have been made - including updated value, date updated and the user that made the change.
This budget is a guide for comparison with total cost. The budget is not connected to any data.
Total Costs
Total Costs displays the most progressed intervention costs, based on the selected route filters.
OP costs take precedence over BP costs.
BP costs take precedence over workbank planning forecasts costs.
Business Plan Costs
BP Costs displays the total Business Plan costs.
Oracle Project Costs
The actual costs from Oracle Projects are displayed in the OP Costs display.
Intervention Variances
Intervention Variances requires Oracle Projects (OP) Integration
Intervention Variances displays the total number of interventions that are within (or outside) of acceptable year-to-date variance based on actual spends provided.
The number of interventions on the selected route filters with a larger than 1% variance is displayed, along with the number of interventions with less than 1% variance.
Further intervention variance information can be viewed from the variance report page.
Costs Chart
The costs chart shows a total costs for the control period, showing remitted and unremitted packages seperately.
Clicking on any bar in the chart will display a breakdown of costs.
Volumes Chart
The volumes chart displays the total number of SEUs delivered within a control period.
This can be displayed as AAV, CAV or DAV by selecting the drop-down box.
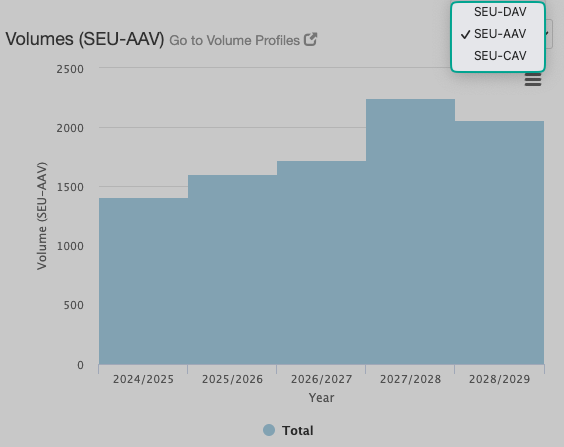
- AAV - Accrued volume
- CAV - Count affected volume
- DAV - Delivered volume