Remaining Asset Life
The Remaining Life dashboard is available by selecting Management, followed by Remaining Life from the sidebar of any workbank.
The following graph will be displayed.
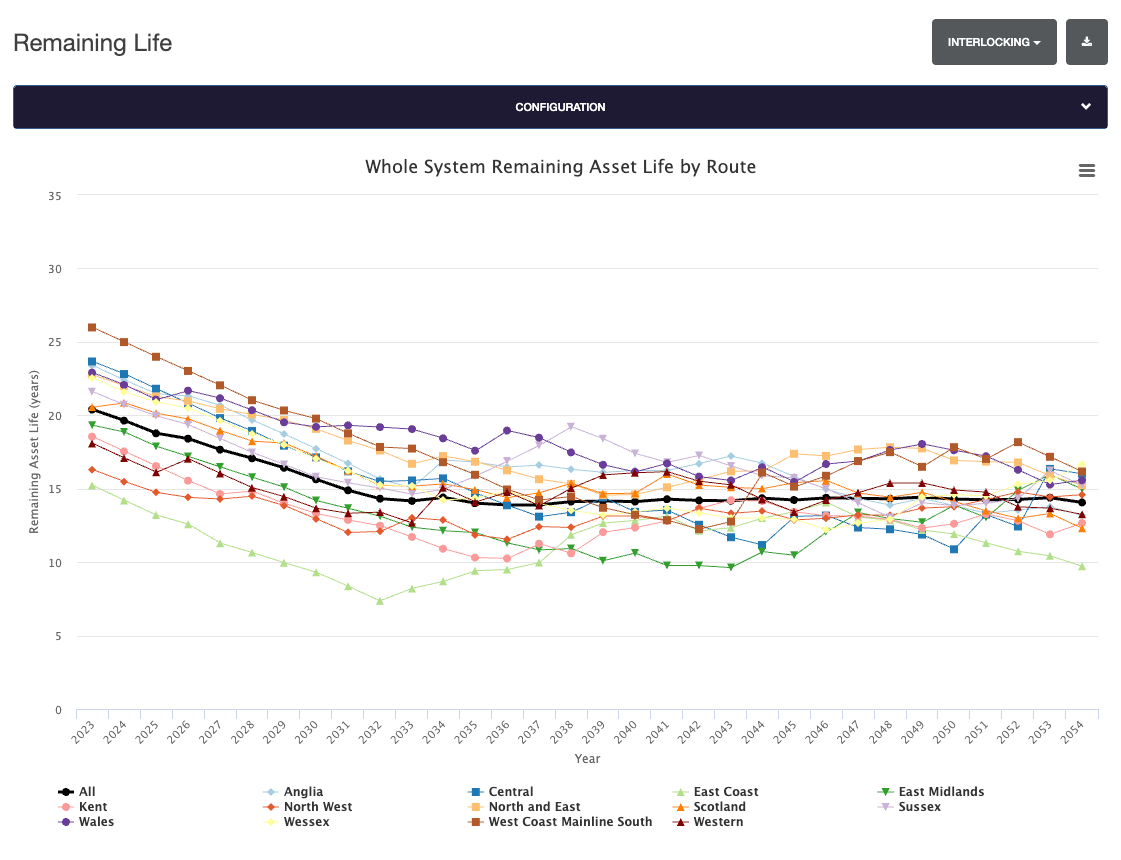
Using the default configuration, the graph displays the percentage of Remaining Asset Life (in years).
Change Discipline
The Remaining Life data is available for a number of disciplines. To change which is displayed

Configure Graph
The graph can be configured to display different data by selecting the Configuration button to expand the area.
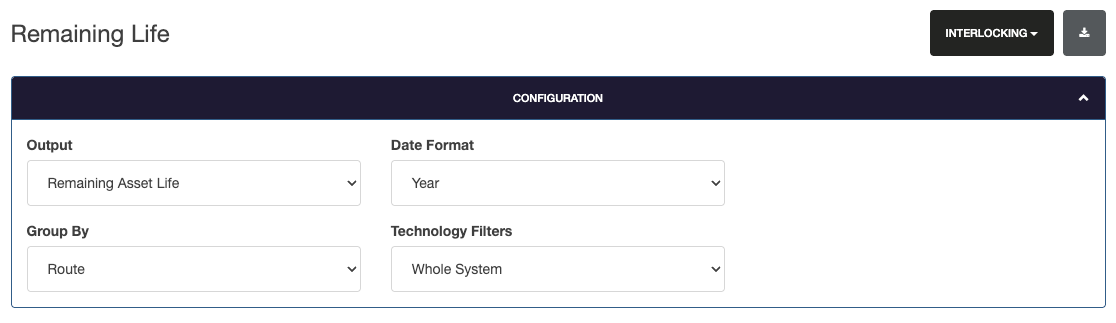
Output
The output can be adjusted to display the total Remaining Asset Life (%), or the percentage of the route that has less than 5 years remaining.
Date Format
Date format allows the graph to be displayed either by year, or control period.
Group By
Group by selects the grouping for the data. Defaulting to route, this can be changed to Region, Technology, Category Schemes and many more.
Technology Filters
Technology filters adds filters to the data to display Whole System, Internals, Externals or Control System.
Exports
Expoerts are available in two formats.
To download the graph, select the icon to the top right of the graph and select the format of the download (PNG, JPEG, PDF)
To download the data, select the export icon next to the discipline box. This exports a CSV containing the displayed Remaining Life Data.