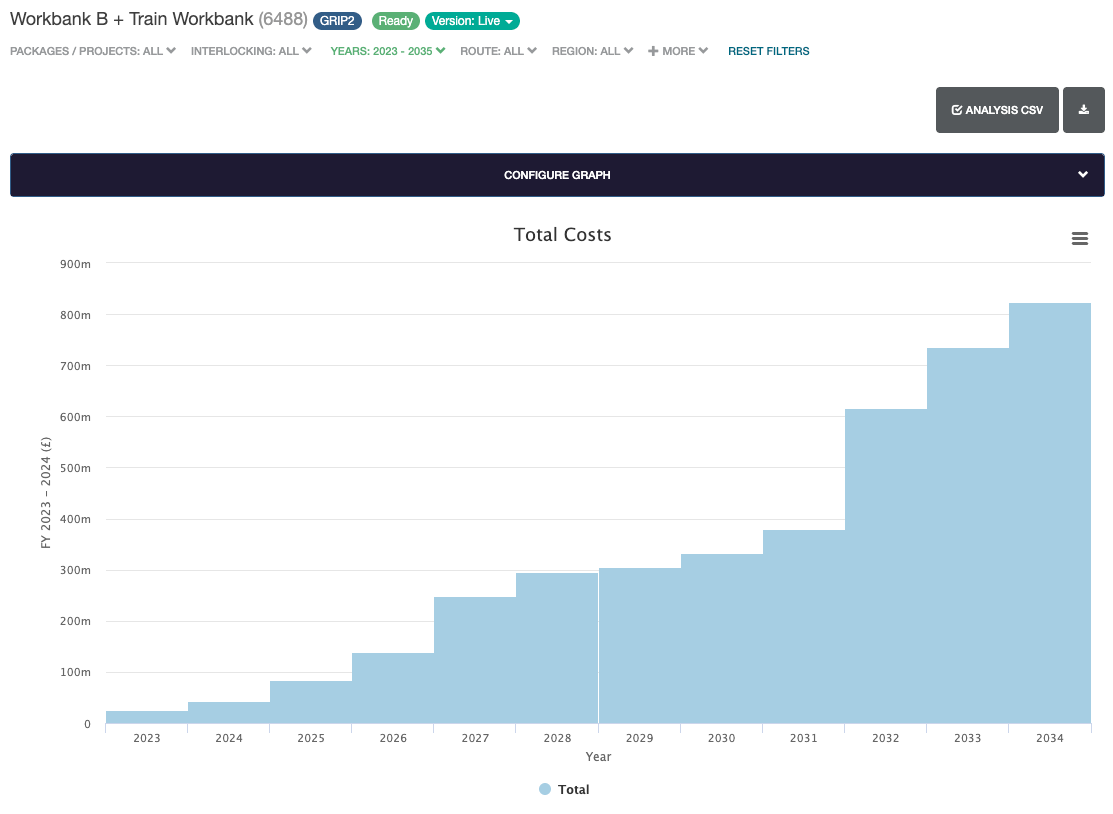
Cost Graphs
Cost Graphs can be viewed by selecting Commercial -> Cost Profiles from the sidebar of any train workbank.
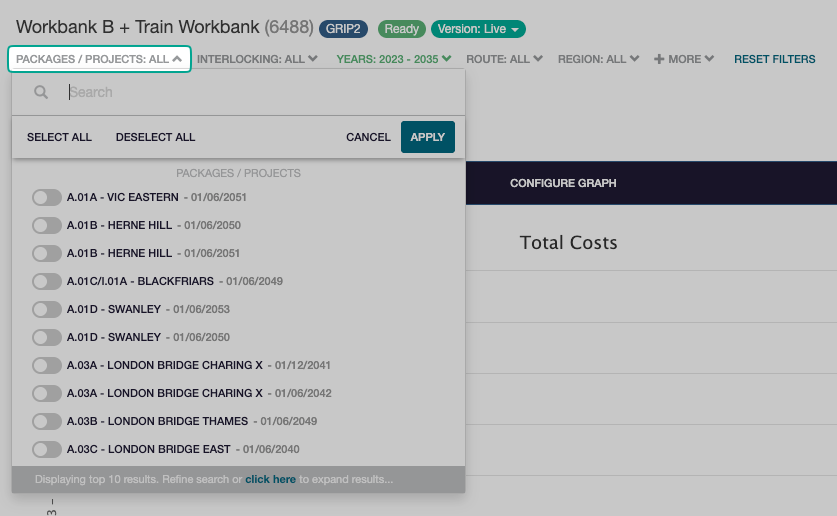
Filter Projects
Graphs can be filtered to only show specific projects.
To do this, select Packages / Projects from the filter bar and toggle the projects to be included, then click Apply.
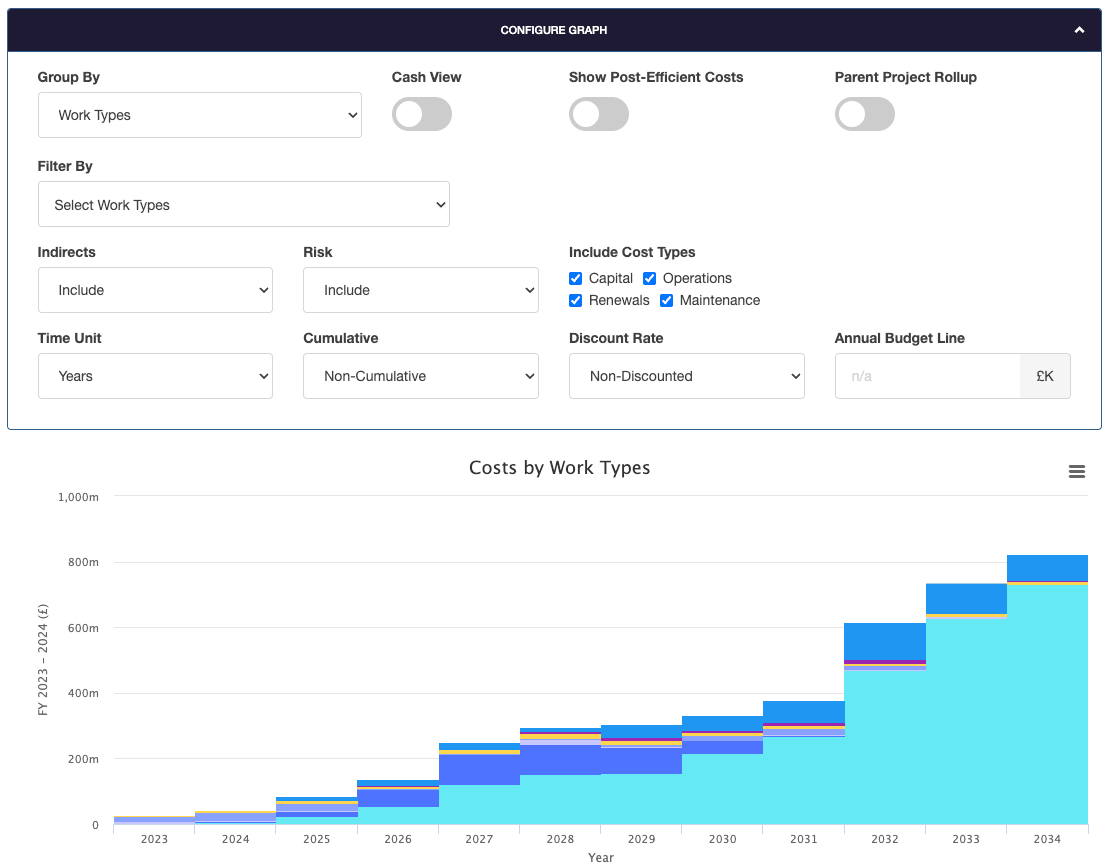
Graph Configuration
The graph can be configured to show a different set of data. Select Configure Graph to display the different options available.
The example below shows costs by work type (the different deployment stages)